How four reporting lenses turn BGV/IDV data into auditable, actionable governance.
This artifact defines four operational lenses to organize BGV/IDV reporting into actionable, audit-ready outputs for HR, Compliance, IT, and Procurement. Each lens groups related questions into a coherent set of dashboards, artifacts, and interpretability features that help manage risk, maintain compliance, and improve hiring velocity.
Is your operation showing these patterns?
- Consent drop-offs spike during onboarding
- Escalation ratio fluctuates with evidence gaps
- TAT distributions shift under surge conditions
- Audit artifacts require regulator-ready formats on demand
- Vendor SLA breaches trigger credits and renegotiation
- Non-PII performance metrics used for cross-vendor benchmarking
Operational Framework & FAQ
Operational dashboards, SLA & throughput
This lens covers core operational metrics, SLA adherence, vendor performance, TAT distributions, and cost visibility to support hiring velocity and governance.
For BGV/IDV, what dashboards do HR and Compliance usually want to track TAT, hit rate, and escalations by check bundle and vendor?
C1736 Core ops and SLA dashboards — In employee background verification (BGV) and digital identity verification (IDV) operations, what dashboards do HR Ops and Compliance typically expect for SLA/TAT distribution, hit rate, and escalation ratio at the check-bundle and vendor level?
In employee BGV and IDV operations, HR Ops and Compliance teams typically expect dashboards that summarize SLA and TAT behavior, hit rate, and escalation ratio at both the check-bundle level and the vendor level. These views help them manage daily throughput, monitor risk, and prepare for governance reviews.
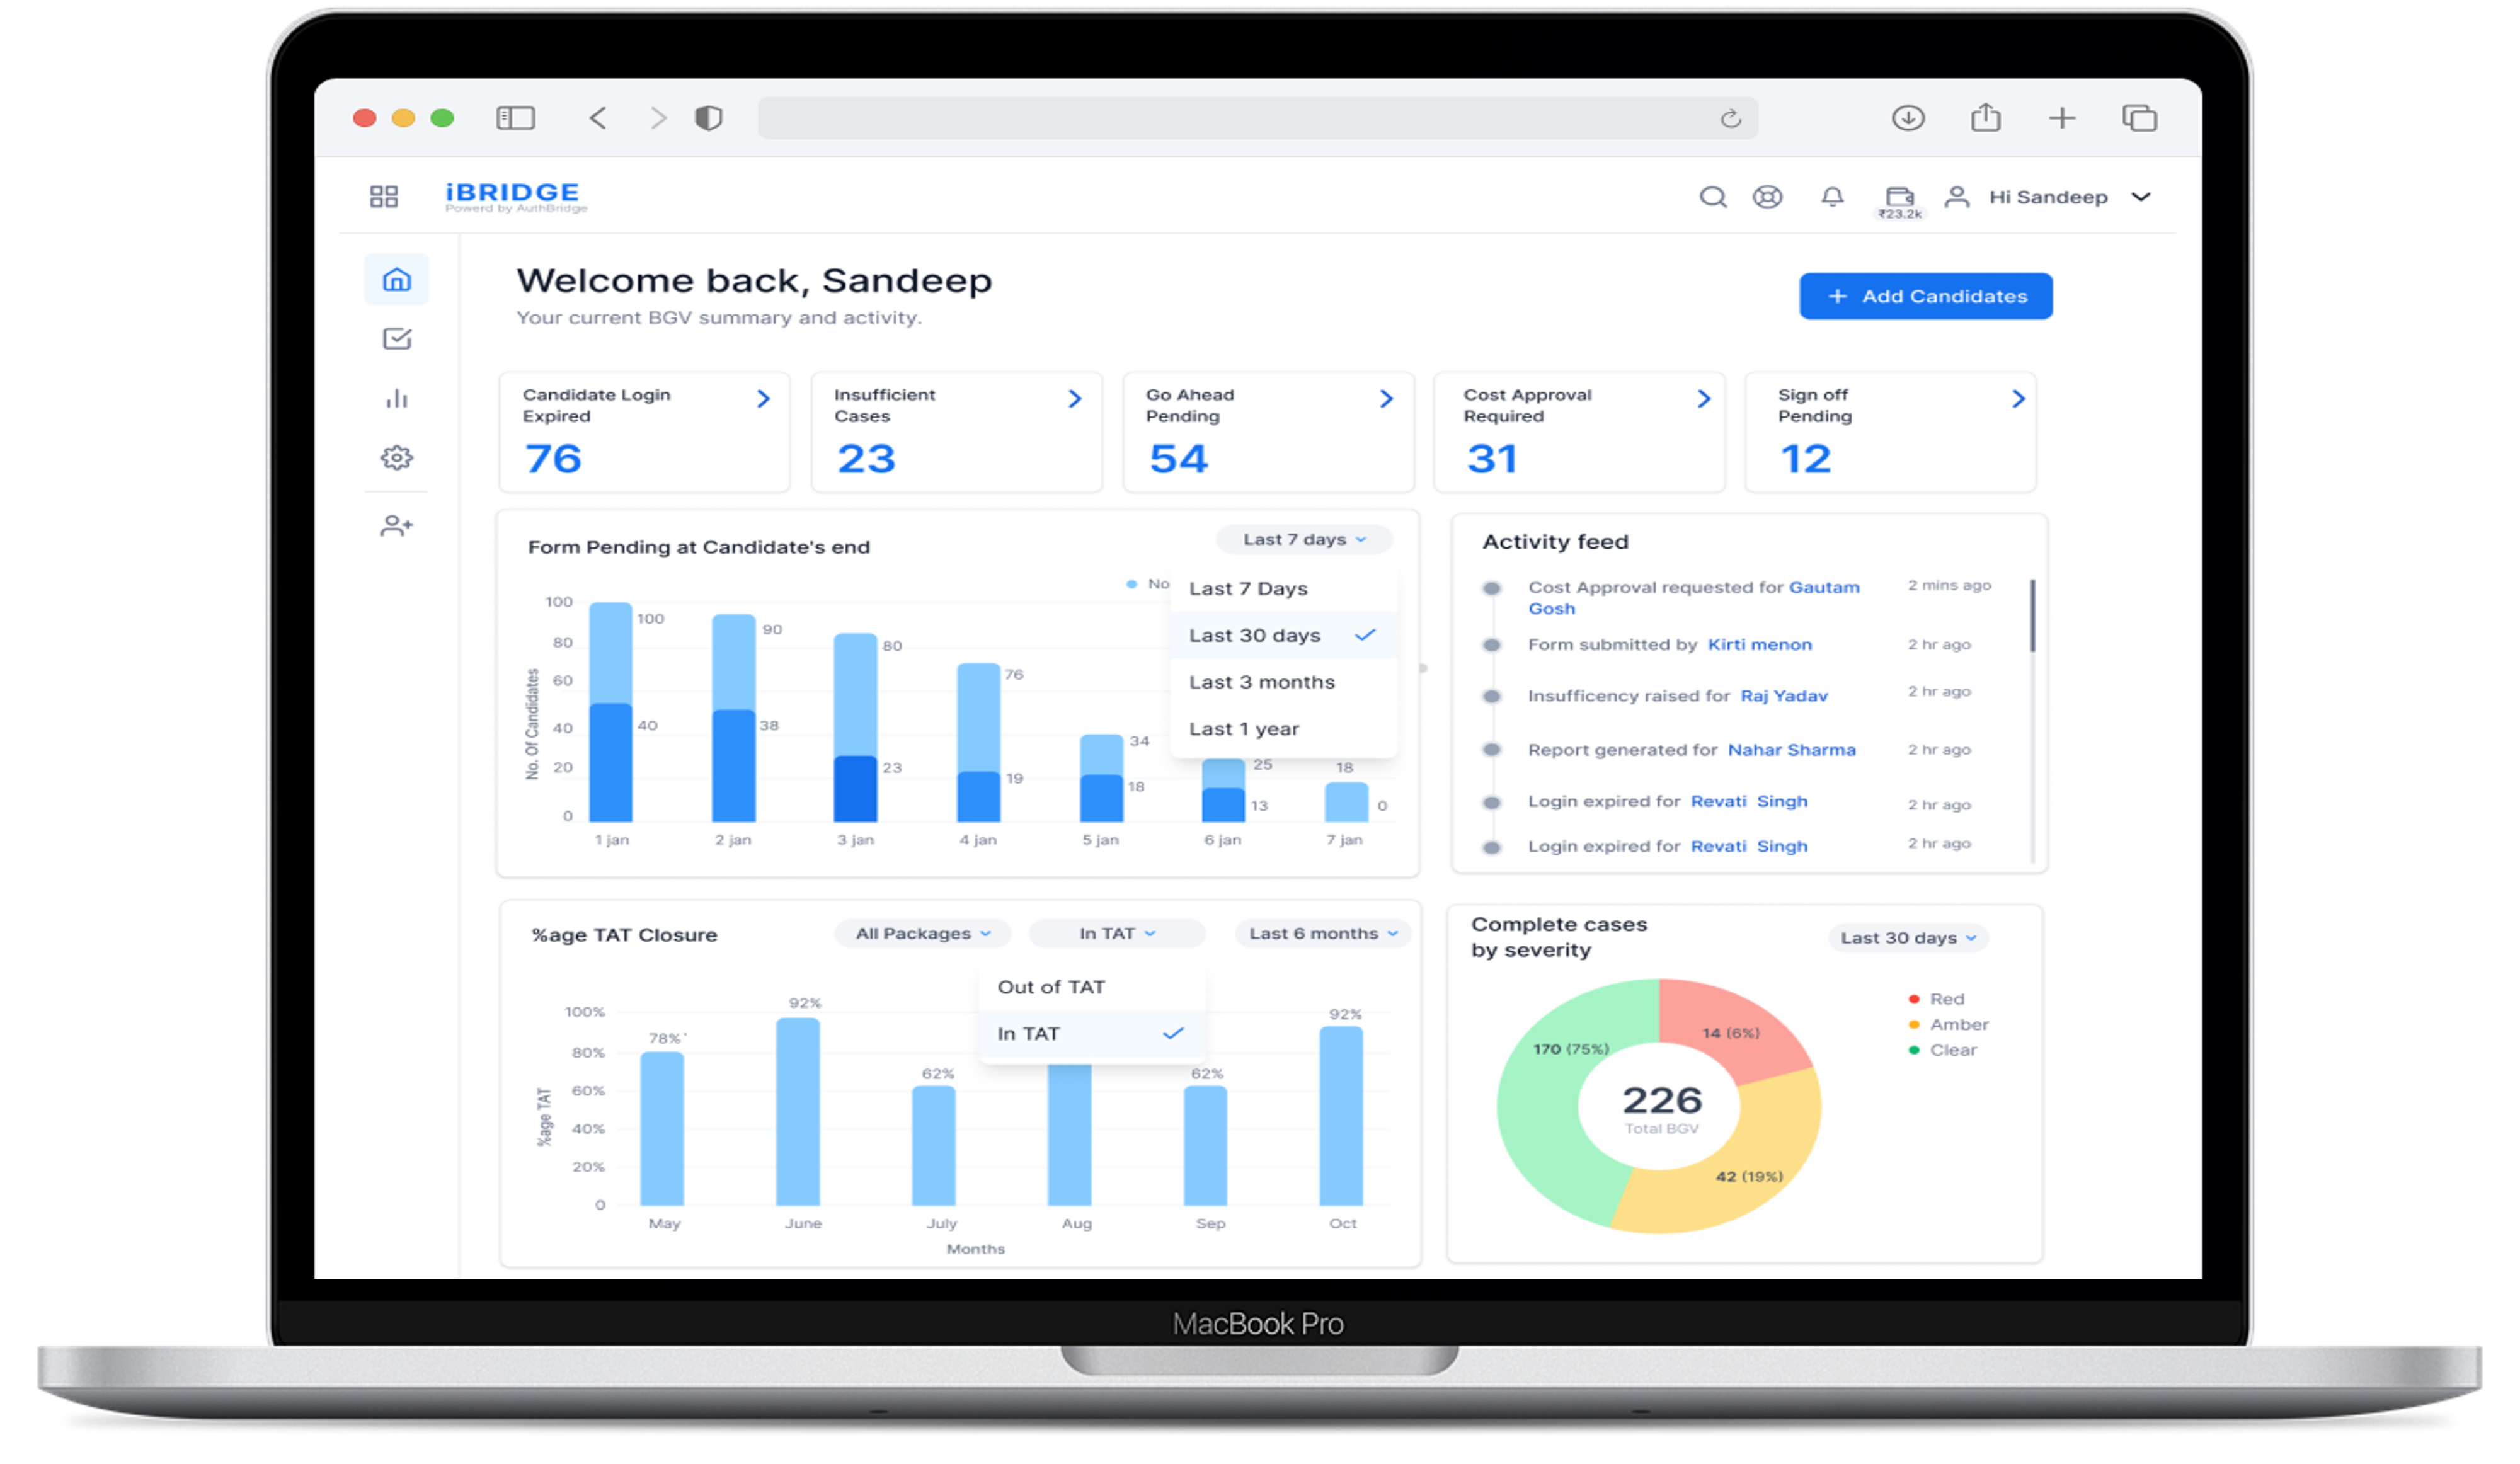
Operational dashboards commonly include tiles or summary cards for key workflow states, such as cases pending at the candidate, insufficient cases, go-ahead pending, cost approvals required, and sign-off pending. Charts often display forms or checks pending at the candidate end and case-closure performance against agreed TAT bands.
Teams also look for panels that break out completed cases by severity or discrepancy level and that show TAT distributions by check bundle. For example, they may view how often full bundles including employment, education, address, and criminal checks close within certain time ranges, and how this compares to SLA targets.
Hit-rate and escalation information is expected as segmented views. HR and Compliance may want to filter by role category, geography, and vendor to see where verification success is strong and where escalations cluster. Vendor-level summaries that show each provider’s share of cases, turnaround profiles, and escalation ratios support vendor management and QBR discussions.
Separate but connected reporting or drill-down screens are often used for consent logs, activity feeds, and evidence traces. These views allow Compliance to inspect individual cases, see when candidates provided consent, and review the sequence of verification events for audit and dispute resolution.
Do you report TAT as p50/p90/p99, and can you split delays caused by the vendor vs the candidate (consent/doc resubmits)?
C1741 TAT distributions and delay attribution — In employee BGV operations, what are best practices for reporting turnaround time (TAT) as distributions (p50/p90/p99) rather than averages, and how should the dashboard separate vendor delays from candidate delays (e.g., consent drop-offs, document resubmits)?
Employee background verification TAT is best reported using percentile distributions such as p50, p90, and p99 for each check type and for the overall case lifecycle. Percentile-based TAT reporting highlights typical performance and long-tail delays more clearly than a single average value.
Most organizations compute p50, p90, and p99 separately for major verification types and for complete cases. Operations teams then review distributions by time period and risk tier to see whether slow tails are concentrated in specific checks or segments. Regulated checks with hard cut-offs are often tracked with stricter percentile thresholds than best-effort checks, so governance teams should align percentiles and alert thresholds with policy and SLA definitions.
To separate vendor delays from candidate delays, background verification platforms usually log time-stamped state changes across the case. Candidate-linked states include consent sent, consent completed, documents requested, documents uploaded, and resubmission requested. Verification-linked states include check initiated, data source queried, escalation started, and result returned. Internal HR or risk approvals may be tracked as a third category to avoid misclassifying internal delays as vendor or candidate issues.
Dashboards can then compute segment-wise TAT distributions for candidate-controlled intervals, vendor or data-source intervals, and internal-approval intervals. Candidate-facing TAT distributions help HR optimize consent flows, reminders, and document guidance without weakening controls. Vendor-facing distributions help Procurement and Operations evaluate data-source performance and escalation patterns. Detailed timestamp logs must be governed under organizational privacy policies with clear consent, retention, and minimization rules.
What reporting do you give IT/security for uptime, latency, webhook failures, and retries during peak onboarding?
C1742 SRE-grade IDV observability reporting — In digital identity verification for hiring, what reporting is most useful to the CISO for monitoring API uptime SLA, latency ceilings, webhook failures, and retry/backoff behavior during onboarding spikes?
CISOs monitoring digital identity verification in hiring need reporting that exposes reliability and performance of APIs and webhooks as measurable service indicators. The most useful dashboards summarize API uptime against SLA targets, latency distributions for key endpoints, webhook delivery and processing failures, and retry or backoff activity during onboarding spikes.
API uptime reporting usually includes daily and monthly availability percentages, incident counts, and error-rate trends. Where vendors provide only coarse SLA reports, CISOs may supplement with local reverse-proxy or gateway logs to approximate endpoint-level uptime and failure patterns. Latency reporting is most actionable when it shows percentile-based response times such as p50, p90, and p99 for critical identity-proofing endpoints, with clear maximum latency ceilings that are aligned to acceptable candidate wait times in HR and onboarding flows.
Webhook reporting should distinguish successful deliveries, delivery failures, processing failures on the client side, and messages still pending. Where detailed retry metrics are available, teams typically track average retries per message, time-to-success after first failure, and counts of messages that exceeded retry or backoff limits. If visibility is limited to aggregate failure counts, IT can still correlate spikes in webhook errors with onboarding volume to infer pressure points.
For governance, CISOs often complement real-time telemetry with periodic reports for audits and QBRs that summarize uptime SLA adherence, notable incidents, latency excursions beyond agreed ceilings, and remediation actions. Correlating these metrics with HR funnel data helps distinguish technical degradations that materially affect candidate experience from minor fluctuations that remain within acceptable onboarding thresholds.
How do you report coverage vs ‘unable to verify’ so HR can treat gaps fairly and consistently?
C1743 Coverage vs unable-to-verify clarity — In employee background checks (employment/education/CRC/address verification), how should a BGV platform report verification coverage versus "unable to verify" outcomes so HR leadership can interpret gaps without over-penalizing candidates?
Employee background check platforms should report verification coverage and "unable to verify" outcomes so that HR leadership can see data-source limitations separately from candidate risk. Useful reporting distinguishes checks that completed with clear results from checks that were inconclusive despite reasonable effort.
Most implementations classify each check type, such as employment, education, criminal or court records, and address verification, into a small set of standardized outcomes. Typical categories include verified, discrepancy found, and unable to verify. Within unable-to-verify, reason codes are often captured, such as non-responsive employer or institution, no records located in the searched registry, data-source outage, or insufficient or inconsistent input data. The specific taxonomy can vary by organization and sector.
Dashboards commonly aggregate these outcomes by time period, geography, and business unit while keeping reason codes visible. High rates of non-responsive issuers or weak registry coverage point to structural or data-quality gaps rather than intentional misrepresentation. In jurisdictions with partial digitization, "no records located" in criminal or court databases may represent an inconclusive result rather than a confirmed clean record, so risk and compliance teams should define how such labels are interpreted in policy.
To support fair adjudication, reporting should also separate checks never initiated because consent was missing from checks that were fully attempted but inconclusive. HR, Risk, and Compliance can then jointly decide when unable-to-verify outcomes trigger requests for alternative evidence or references instead of automatic rejection, aligning workforce risk appetite with regulatory expectations.
How do your dashboards show false positives and rework so we can fix the process, not just blame reviewers or candidates?
C1746 FPR and rework visibility — In employee BGV adjudication, how should dashboards represent false positives and rework (e.g., escalations later cleared) so Operations can target process fixes rather than blaming reviewers or candidates?
In employee BGV adjudication, dashboards should represent false positives and rework as explicit stages in the verification flow so Operations can see where rules or data sources are generating avoidable escalations. Simply reporting final adverse outcomes without showing how many were later cleared hides important quality and productivity signals.
Most programs track checks through stages such as initial flag raised, escalated for manual review, cleared, or confirmed discrepancy. Reporting can then derive metrics like escalation ratio, share of escalations ultimately cleared, and estimated reviewer time spent on cleared cases. These metrics approximate false-positive and rework levels even though underlying ground truth is never perfect.
To avoid a blame culture, dashboards should emphasise process dimensions rather than individuals. Useful breakdowns segment cleared escalations by check type, jurisdiction, data source, or specific rule or score threshold that triggered the flag. Reviewer-level metrics, when required for coaching, are typically interpreted alongside case complexity and volume so they inform training rather than punishment.
Linking these views to operational KPIs highlights why they matter. High proportions of cleared escalations usually correlate with longer TAT, higher escalation ratios, and lower reviewer productivity. When Operations teams can see these patterns, they are better equipped to refine matching logic, adjust thresholds for certain data sources, or improve candidate data collection, reducing unnecessary rework while preserving verification depth and compliance defensibility.
Do you report onboarding funnel drop-offs from consent to completion so HR can improve the candidate journey without cutting checks?
C1749 Candidate funnel and drop-off analytics — In BGV/IDV implementations integrated to HRMS/ATS, what reporting shows end-to-end funnel drop-offs (consent initiated → consent completed → docs uploaded → verification complete) so HR can optimize candidate experience without weakening controls?
In BGV and IDV implementations integrated with HRMS or ATS systems, end-to-end funnel reporting should show candidate progression from consent initiation through verification completion. Such reporting helps HR understand where candidates abandon the process and refine experience and communication without automatically diluting controls.
Common funnel stages include invitation or link sent, consent initiated, consent completed, documents requested, documents uploaded, verification started, and verification completed. Dashboards typically display volumes and conversion percentages between these stages, and where instrumentation permits, median time spent at each step. When integrations are batch-based or loosely coupled, some stages may be inferred from timestamps or status codes rather than captured as explicit events.
To keep optimization aligned with risk posture, HR and Compliance should jointly interpret where drop-offs occur. High attrition between consent initiated and consent completed can prompt clearer explanations of data use, better mobile layouts, or reminders rather than removal of consent steps. High drop-off at document upload may indicate confusing instructions or inadequate support instead of excessive verification scope.
When candidate identifiers are consistent across HRMS, ATS, and the verification platform, organizations can correlate funnel stages with outcomes such as time-to-hire and joining conversion. These correlations are directional rather than proof of causality, but they help teams evaluate whether UX changes improve throughput without compromising verification depth, consent quality, or sectoral compliance obligations.
Can your reporting link ops metrics like TAT and escalations to time-to-hire and joining conversion in a defensible way?
C1754 Ops metrics linked to outcomes — In employee background screening analytics, what reporting connects operational metrics (TAT, escalation ratio, reviewer productivity) to business outcomes like time-to-hire and joining conversion, without overstating causality?
In employee background screening analytics, reporting should place operational metrics such as TAT, escalation ratio, and reviewer productivity alongside business outcomes like time-to-hire and joining conversion, while making clear that these relationships are observational. The goal is to support decisions with correlated insights, not to claim that screening metrics alone cause hiring results.
Where identifiers and time windows can be aligned across HR and BGV systems, dashboards often group cases into cohorts by role, region, or hiring channel and present verification TAT distributions, escalation rates, and reviewer throughput next to offer acceptance and joining conversion for the same cohorts. Analysts can then observe patterns, such as faster verification being associated with higher conversion in certain segments, while acknowledging that market conditions and other HR processes also play roles.
Segmentation and context are essential. Checks for high-risk or regulated roles may have intentionally longer TAT or higher escalation ratios because of deeper verification policies. Reporting should mark these roles clearly so that longer timelines are not misread as operational failure. Some organizations introduce structured annotation fields for major events such as policy changes, new vendors, or market shocks so that trend lines can be interpreted against known confounders.
Governance discussions based on these reports should emphasise trade-offs. Reducing rework or improving data quality can often shorten TAT and support hiring throughput, but removing or diluting critical checks purely to improve headline time-to-hire may conflict with risk appetite or regulatory expectations. Labelling charts explicitly as correlation or trend analysis helps prevent overreach and maintains analytical integrity.
How is the reporting UI designed so ops teams can triage anomalies and generate audit bundles quickly without too many clicks?
C1755 Low-friction reporting UX for ops — In BGV/IDV reporting, what UI and workflow design reduces 'click fatigue' for Verification Program Managers who need to triage anomalies, review evidence, and generate audit bundles under time pressure?
In BGV and IDV reporting, UI and workflow design reduce click fatigue for Verification Program Managers when they organize information around tasks and exceptions rather than static lists. The aim is to let managers triage anomalies, review evidence, and generate audit bundles with minimal navigation while still supporting detailed inspection where needed.
Best-practice dashboards present prioritized queues for exception categories such as high-severity discrepancies, SLA-at-risk cases, and open disputes. Each queue entry typically shows an inline summary of key attributes, including case severity, age, current status, and a short evidence or risk synopsis, so managers can make many routing decisions without drilling into full case views. Where supported by the platform, single-click access to complete timelines and document previews avoids repeated back-and-forth navigation.
For audit preparation, template-based export workflows are more efficient than case-by-case assembly. Managers select a set of cases or a time window, choose a preconfigured evidence-pack template that bundles consent references, check results, and audit events, and trigger export as a single action. Progress indicators for these batch jobs allow oversight without continuous manual refresh. In environments with more limited tooling, even simple improvements like grouping export options by audit type or providing standard report templates can materially reduce operational friction.
Additional UX elements such as consistent layouts, saved filters for common views (for example, cases nearing SLA expiry or unresolved disputes), and keyboard shortcuts contribute incremental gains. When combined, these design choices support higher reviewer productivity and more reliable SLA adherence by reducing the cognitive and click load on managers during high-pressure verification and audit periods.
How do your reports help us spot cost creep early—like escalations or re-verifications—so renewal doesn’t become a surprise?
C1761 Reporting to prevent cost creep — In employee background verification procurement, how can reporting be used to prevent a renewal surprise by exposing leading indicators of cost creep, such as higher escalation ratios or repeated re-verification due to poor evidence quality?
Reporting prevents renewal surprises in background verification contracts when it exposes leading indicators of cost creep, such as escalation ratios and re-verification rates, broken down by check type and root cause. Renewal-safe reporting focuses on cost drivers rather than only total spend or average cost per verification.
Effective reporting separates base verification volume from rework volume. The reporting shows which cases are first-pass checks and which are repeats triggered by poor evidence quality, incomplete candidate data, or data-source issues. Escalation ratio reporting specifies how many checks required manual intervention, the median age of escalations, and the distribution by check category such as employment verification, address verification, or criminal record check. This structure links rising escalation load to specific workflows and cost lines.
Cost driver attribution is more defensible when reports tag re-verifications by cause category such as candidate non-response, employer or institution non-response, field visit failure, or inconsistent documents. This approach lets buyers distinguish vendor-driven rework from policy-driven or candidate-driven rework. Trend reporting then correlates cost per verification with escalation ratios, re-verification counts, and hit rate changes by check type and business unit. Operations and procurement can review these trends quarterly and adjust policies, evidence standards, or vendor expectations before renewal, rather than discovering cost creep only when annual invoices are reconciled.
In a pilot, what reporting mistakes create a false ‘good’ result, and how do you design dashboards to avoid that?
C1764 Pilot reporting anti-patterns — In employee BGV/IDV pilots, what reporting pitfalls most commonly create a false sense of performance—such as using averages instead of distributions, hiding sample bias, or excluding exception flows—and how should the pilot dashboard prevent these errors?
Pilot reporting in BGV and IDV programs creates a false sense of performance when it shows only averages, hides sample composition, or omits exception paths such as escalations and “unable to verify” outcomes. A reliable pilot dashboard must foreground distributions, segment mix, and exception behavior for each check type.
Average TAT can mask critical long tails, so the pilot dashboard should show TAT distributions with percentile bands and outlier counts per check bundle and risk tier. This reveals whether a subset of address verification or criminal record checks consistently breaches SLA even when the mean looks acceptable. Sample bias arises when the pilot focuses on low-risk or urban roles, so the dashboard should display volume by designation, location, and check bundle to indicate how closely the pilot resembles expected production mix.
Exception flows need dedicated reporting panels. The dashboard should surface counts and ratios for escalations, “unable to verify” results, insufficient documents, and candidate drop-offs alongside successful completions. When these distributions and exception metrics are visible, buyers can judge pilot performance against the decision logic described in the buying journey, rather than extrapolating from a narrow, clean subset of cases.
Can your reporting show queue aging and reviewer workload so Ops can justify staffing instead of just being told to go faster?
C1769 Queue aging and staffing defensibility — In employee BGV operations, what reporting is available to show reviewer workload, queue aging, and bottlenecks so Operations can defend headcount needs rather than being told to "work faster"?
In employee BGV operations, reporting that describes reviewer workload, queue aging, and structural bottlenecks helps Operations justify headcount and process changes using objective evidence. These reports focus on case volumes, complexity mix, and time-in-queue relative to agreed TAT and SLA targets.
A workload view shows how many open cases sit in each review queue, segmented by check type such as employment verification, education verification, address verification, or criminal record checks. It can indicate complexity by tagging checks that frequently escalate or require manual investigation. Queue aging reports display how long cases have been waiting at each stage, broken down by risk tier, business unit, and exception status like insufficient information or “unable to verify.”
Bottleneck reports highlight stages and check types where queues repeatedly cause TAT breaches and lower case closure rates. When Operations combine these views with aggregate reviewer productivity and escalation ratios, they can demonstrate that backlogs stem from volume and complexity constraints rather than simply asking reviewers to “work faster.” This framing connects headcount and automation discussions to enterprise KPIs such as SLA adherence and case closure performance, which resonates with Finance and Compliance stakeholders.
What reporting obligations should we lock into the SLA so we’re not dependent on ad-hoc vendor help during disputes?
C1770 SLA-backed reporting obligations — In employee BGV/IDV contracting, what standard reporting commitments should be written into SLAs (frequency, data fields, evidence availability) so Procurement is not dependent on ad-hoc vendor cooperation during disputes?
In employee BGV and IDV contracting, SLAs should define a standard reporting pack that specifies which metrics are provided, how often they are delivered, and what evidence is accessible for sampling. Clear commitments reduce Procurement’s dependence on ad-hoc vendor cooperation during disputes.
Operational reporting clauses typically cover TAT distributions, hit rate, escalation ratios, case closure rate, and uptime, with breakdowns by check type, risk tier, and business unit. The SLA should state reporting frequency, such as monthly operational summaries and quarterly governance reviews, and the minimum structure of each report, for example inclusion of distributions rather than only averages.
Compliance reporting clauses define access to consent logs, audit trails, and retention or deletion performance at an aggregated level. Evidence availability clauses clarify how long case-level data and artefacts such as documents, field reports, and decision logs will be retained and under what conditions they can be accessed for sampling. They also set response times for information requests during audits or disputes. When these reporting and evidence standards are written into the SLA, Procurement and Compliance can enforce expectations using agreed remedies instead of renegotiating data access for each incident.
If a data source breaks or changes format, what reporting shows the impact on hit rate, TAT, and ‘unable to verify’ by check type right away?
C1776 Source outage impact reporting — In employee BGV/IDV operations, if a data source changes format or goes partially offline, what scenario-based reporting shows immediate impact on hit rate, TAT distributions, and 'unable to verify' rates by check type?
In employee BGV and IDV operations, when a data source changes format or becomes partially unavailable, reporting should quickly show the impact on hit rate, TAT distributions, and “unable to verify” rates by affected check type. This lets teams respond with fallbacks or policy adjustments before SLA breaches accumulate.
Impact reporting segments metrics by check category that depends on the source, such as employment verification, education verification, criminal record check, or court record search. Dashboards compare completion rates, average and percentile TAT, escalation ratios, and “unable to verify” outcomes for recent periods against a baseline window before the source issue. Filters by business unit and risk tier show which segments are most exposed.
Reports should mark the time window during which the data source issue occurred so Compliance and IT can align incidents with observed metric shifts. Annotated trend lines that show when temporary measures, such as alternate workflows or relaxed thresholds, were activated help later review the effectiveness of responses. This scenario-aware reporting structure supports both real-time decision-making and retrospective analysis of data-source-related risks.
Can Finance forecast spend from reporting—using CPV, rework, and escalations—without needing raw candidate data?
C1784 Spend forecasting from reporting — In employee screening analytics, what reporting helps Finance understand unit economics drivers (cost per verification, rework, escalations) and forecast spend under different hiring volumes without requiring access to raw PII?
Finance can understand unit economics in employee screening when reporting summarizes key cost drivers such as cost per verification, rework, and escalations in an aggregated, de-identified format. These reports should emphasize metrics by check type, risk tier, or business unit rather than candidate-level detail so that Finance does not need access to raw PII.
A practical approach is to aggregate verification volumes and associated commercial impact by categories like identity proofing, employment and education checks, address verification, and criminal or court record checks. Screening analytics can also surface operational KPIs that influence total cost per verification, including escalation ratios, reviewer productivity, and average TAT distributions. Finance teams can then combine these operational metrics with contracted pricing models to forecast spend under different hiring volumes and mix of checks.
Privacy-by-design expectations mean Finance typically receives only summarized or pseudonymized reports, with any segmentation limited to what is necessary for financial planning. Providing clear metric definitions and explaining how KPIs are computed across data sources helps Finance, Data, and HR maintain a shared understanding of CPV, rework rates, and SLA adherence. When such reporting is absent, organizations often fall back to manual spreadsheets assembled from operational exports, which creates version-control risks and makes it harder to reconcile financial forecasts with authoritative verification KPIs.
Do you show clear exception reasons (consent missing, docs unreadable, source down) plus next actions so ops teams reduce back-and-forth?
C1786 Exception reasons with next actions — In employee BGV/IDV workflows, what operator-level reporting shows exception reasons (missing consent, unreadable docs, source downtime) and recommended next actions to reduce back-and-forth with candidates?
Operator-level reporting in BGV/IDV workflows is most effective when it makes exception reasons explicit and ties them to clear next-step guidance. This reduces back-and-forth with candidates and helps verification teams resolve bottlenecks without relying on free-text notes.
A practical design is to classify each exception with structured labels that distinguish issues such as missing or invalid consent, unreadable or incomplete documents, candidate form incompletion, and upstream registry or court database unavailability. Operational views can then summarize exception volumes by type and by check category, including identity proofing, employment and education verification, address checks, and criminal or court record screening. This allows operators to identify patterns, such as a spike in document-quality problems for a specific business unit, and respond in a targeted way.
Reporting can also reference standardized playbooks that describe recommended actions for each exception category, consistent with the organization’s policies and regulatory obligations. For example, consent-related exceptions may require obtaining or confirming appropriate consent before continuing processing, while document-quality exceptions may be resolved by prompting candidates to resubmit higher-quality evidence through a self-service channel. Where exceptions remain unstructured, teams tend to depend on manual interpretation, which increases TAT and escalation ratios and makes it harder to maintain consistent, defensible workflows.
Do you offer benchmarking reports vs similar customers (industry/geo/check mix) so we can judge performance as a ‘safe standard’?
C1788 Peer benchmarking beyond references — In employee BGV/IDV, what reporting is available to benchmark performance against peer cohorts (industry, geography, check mix) in a way that supports 'safe standard' decision-making without relying on vague reference claims?
Benchmarking reporting in BGV/IDV supports “safe standard” decision-making when it compares an organization’s screening metrics against anonymized peer cohorts using clear, shared definitions. This approach is stronger than relying on qualitative references or generic claims that competitors follow similar practices.
Relevant benchmarking dimensions include industry, geography, and check mix across identity proofing, employment and education verification, address verification, criminal and court records, and sanctions or adverse media screening. Metrics such as discrepancy rates by check type, TAT distributions, escalation ratios, and hit rates can be compared to aggregated cohort values to show whether an organization’s verification depth and speed are broadly aligned with peers or deviate significantly. Risk and Compliance teams can then review these differences in the context of their own risk appetite and regulatory environment.
Any benchmarking data used for such comparisons should be de-identified and aggregated so that no individual candidates or source organizations are exposed, and it should be based on transparent metric definitions and cohort construction rules. Without these safeguards, benchmarking can devolve into unsubstantiated marketing narratives rather than decision-grade analytics, leaving CHROs and Compliance leaders without defensible evidence when calibrating their BGV/IDV programs.
Do you provide one-click exports and pre-built views so teams don’t create shadow spreadsheets that leak data or diverge in versions?
C1790 Reduce shadow spreadsheets via exports — In employee BGV/IDV reporting UX, what 'one-click' exports or pre-built views exist for auditors, Finance, and HR so teams do not build shadow spreadsheets that create version-control and data-leak risks?
In BGV/IDV reporting UX, well-designed “one-click” exports and pre-built views for auditors, Finance, and HR reduce the need for shadow spreadsheets and help keep everyone aligned on a single source of truth. These views should reflect each stakeholder’s information needs and access rights while enforcing privacy and purpose limitation.
Audit-focused exports can emphasize consent and deletion records, audit trails and chain-of-custody logs, and KPI distributions such as TAT, hit rate, false positive rate, escalation ratios, and case closure rates. Finance-oriented views benefit from aggregated verification volumes by check type or business unit, SLA adherence metrics, and escalation or rework statistics that Finance can combine with commercial terms to understand cost drivers, without exposing candidate-level PII. HR-focused exports typically center on candidate case status, turnaround-time dashboards, and discrepancy trends that impact hiring throughput and candidate experience.
These exports are most useful when they are easy to generate from the reporting interface in standard formats and when metric definitions are documented or linked so numbers are interpreted consistently. Role-based controls and download permissions remain important because even convenient exports can create leak or misalignment risks if they are widely distributed or retained indefinitely. When such views are absent, teams often build their own spreadsheets, which fragments data, complicates reconciliations, and weakens governance.
Can your reporting clearly show SLA breaches, credits owed, and repeat patterns so Procurement can enforce remedies?
C1791 SLA breach and credit reporting — In employee BGV/IDV vendor management, what reporting helps enforce SLA remedies—showing breaches, credits owed, and repeat patterns—so Procurement can avoid a situation where issues are acknowledged but never penalized?
In BGV/IDV vendor management, SLA-enforcing reporting must quantify when and how agreed performance thresholds were not met and make repeat patterns visible. Procurement, HR, and Risk can then use objective evidence to apply remedies such as credits or to escalate service issues, instead of relying on informal complaints.
Key reporting elements include time-stamped performance metrics against contracted SLAs for turnaround time, API uptime, case closure rates, and escalation ratios or similar indicators. Dashboards and exports that show distributions of TAT, counts of late cases, frequency of technical incidents, and severity of delays by check type or geography help stakeholders understand both the scale and the business impact of deviations. Trend views can highlight recurring problems, such as repeated delays in specific court or education checks.
To support enforcement, organizations should ensure that performance data can be exported in a way that aligns with how SLAs are defined in contracts, including the relevant time windows and metric definitions. This allows Procurement and Legal to map reported breaches to contractual obligations and determine whether remedies apply. Over multiple quarters, such reporting also feeds into third-party risk assessments and renewal decisions, indicating whether the BGV/IDV vendor consistently meets operational expectations in high-stakes hiring and compliance workflows.
Explainability, interpretability & policy traceability
This lens focuses on how explainable signals, anomaly reasoning, model drift, and policy decisions are documented and surfaced for trust and auditability.
When your system flags an anomaly, how do you explain whether it’s real risk versus a data or OCR issue?
C1737 Explain anomaly versus data issues — In employee BGV and IDV platforms, how should anomaly detection be explained so that an HR decision-maker can distinguish true risk signals from data-quality issues (e.g., fuzzy match variance, missing sources, or document OCR errors)?
In employee BGV and IDV platforms, anomaly detection should be presented to HR decision-makers as a pattern-spotting aid that flags unusual cases for closer review, rather than as an automatic fraud verdict. The key is to explain what is unusual in business terms and how it should influence manual decisions.
True risk-oriented anomalies are cases where attributes or behaviors differ markedly from the organization’s normal verification patterns. Examples include an identity that appears in many verification requests within a short period, an unexpected combination of employment tenures, or repeated discrepancies linked to the same contact details or address. Explanations should state which data points are out of pattern and which verification checks contributed to the alert.
Data-quality-oriented anomalies arise when the system sees irregularities that may reflect noise rather than risk. Fuzzy match variance in names, dates of birth, or addresses, missing or incomplete records from expected data sources, and fields distorted by OCR errors can all produce anomalies that require clarification rather than immediate suspicion.
Dashboards and case views can help by grouping anomaly alerts into categories such as “unusual identity reuse,” “unexpected verification outcome patterns,” and “data completeness or readability issues.” Each alert should include a short, plain-language explanation and a suggested next action, such as initiating a manual review, requesting corrected documents, or checking data-source status.
Organizations should monitor anomaly rates over time alongside metrics like escalation ratio and hit rate. Sudden changes can indicate shifts in candidate behavior, data-source reliability, or policy thresholds. HR leaders should understand that anomaly detection supports triage and continuous improvement of verification policies and integrations, and that final hiring and access decisions remain governed by human review and documented risk policies.
How far can we drill into a trust score explanation without revealing sensitive signals or helping fraudsters?
C1740 Explain trust score safely — In background verification and identity verification workflows, what level of drill-down is realistic for explaining a composite trust score (rules + model) without exposing sensitive features or enabling fraud gaming?
In background verification and identity verification workflows, a realistic drill-down for explaining a composite trust score is to show, for each case, the decision outcome, the main risk dimensions that influenced it, the rules or thresholds that fired, and the linked evidence. This level of detail allows Risk and Compliance to understand and audit decisions without exposing sensitive model internals or enabling fraud gaming.
At the case level, explanations should first state the final risk category and decision path, such as low risk and auto-cleared or higher risk and sent for manual review. They should then identify the key dimensions that affected the score, for example identity assurance, employment and education history, address verification status, and criminal or court check results. Each dimension can be tagged as lowering, neutral, or raising assessed risk.
Explanations should also indicate which explicit rules and policy thresholds were applied. Examples include minimum acceptable match scores for identity checks, mandatory review rules for leadership or regulated roles, and rules responding to particular discrepancy types or unresolved verifications. Each triggered rule should be traceable to underlying evidence, such as specific documents, registry responses, or verification logs, with timestamps.
Beyond individual cases, aggregated reports that show how many cases fall into each score band and how often particular dimensions or rules contribute to escalations help Compliance assess systemic impacts of the scoring policy. These reports support discussions about fairness, proportionality, and threshold calibration.
Details such as full mathematical formulas, internal model parameters, or complete technical architectures are rarely needed for operational explainability and can increase the risk of system gaming. Standardized, business-readable explanation templates, combined with stored audit trails, typically provide an effective balance between transparency and security.
When IDV fails, what explainers do you provide (image quality, liveness, device signals) that our support team can actually act on?
C1747 Actionable explanations for IDV failures — In digital identity verification (document + selfie + liveness) for workforce onboarding, what interpretability is provided for match failures (e.g., face match score components, image quality flags, device risk signals) that a support team can action?
In digital identity verification for workforce onboarding, support teams benefit from reporting that explains why document-plus-selfie-plus-liveness checks failed in clear categories. Instead of a generic failure label, useful interpretability distinguishes issues such as low face match, liveness failure, poor image quality, or device or environment problems so that operations can take targeted action.
Many implementations expose a face match score with a configured threshold and a small set of reason codes. Where the underlying biometric engine supports it, additional indicators such as occlusion, pose or lighting quality, or suspected tampering are logged for internal use. Support teams can then decide whether to ask for a retake, escalate for manual review, or record a potential fraud indicator, even if not all components are visible in every deployment.
Liveness reporting typically identifies whether active or passive liveness checks failed and groups failures by patterns like insufficient movement, timeouts, or repeat frames suggestive of replay. In more mature stacks, device or session-level signals from the client environment, such as unstable network, camera access issues, or anomalous device characteristics, can be reported to distinguish technical friction from suspicious behaviour.
To keep this actionable, platforms usually map raw technical signals into concise guidance messages for support staff, such as prompts to retake the selfie in better lighting, confirm camera and network readiness, or escalate due to risk indicators. Candidate-facing messages are often further simplified to avoid exposing detailed anti-fraud logic, while internal views preserve richer context for operations, risk, and fraud teams.
For continuous monitoring alerts, how do you explain why the alert triggered, how recent it is, and what action we should take next?
C1750 Explainable continuous monitoring alerts — In continuous verification for employees and contractors, how should adverse media/sanctions/court-update alerts be reported with explainable reasoning, recency context, and clear escalation playbooks to avoid unnecessary panic?
In continuous verification for employees and contractors, adverse media, sanctions, and court-update alerts should be reported with clear reasoning, recency context, and structured escalation guidance so that risk teams can act proportionately rather than react with unnecessary panic. Alerts need to distinguish high-risk, recent developments from low-confidence or historical signals.
Useful alert views typically identify the matched person or entity, the underlying data source, and a confidence or match-score indicator with an associated risk tier. Where available, they also expose basic attributes used for the match, such as jurisdiction, list or case type, and publication or last-update dates. High-level severity labels, derived from internal policy, help differentiate critical sanctions or serious criminal cases from lower-risk or informational adverse media items.
Explainability is strengthened when the reporting classifies alert reasons into categories such as financial misconduct, regulatory action, violence, or civil disputes. Systems often flag potential low-confidence matches, such as name-only hits without corroborating identifiers, to signal higher false-positive risk and reduce unnecessary escalation. Continuous monitoring programs should also operate under clearly communicated consent and purpose statements so that employees and contractors understand the nature of ongoing checks.
Clear escalation playbooks are typically embedded alongside alerts, mapping combinations of alert type and severity to next steps, such as enhanced review by Risk, legal assessment, or periodic re-evaluation. By pairing structured reasoning and recency information with policy-driven workflows, organizations can practice continuous verification while maintaining proportional responses and preserving workforce trust.
How do you alert us early if ‘unable to verify’ starts climbing for a source, region, or check type before SLAs get hit?
C1759 Early warning for quality drift — In BGV/IDV operations, what reporting helps detect silent degradation—such as rising 'unable to verify' rates from a particular data source or region—before SLA misses become visible to HR leadership?
In BGV and IDV operations, reporting that detects silent degradation focuses on early quality signals such as rising "unable to verify" rates, hit-rate declines, and increased rework from specific data sources or regions. Monitoring these indicators allows teams to intervene before SLA misses and coverage problems become visible to HR leadership.
Operational dashboards commonly track, over time, the proportion of outcomes by category for each check type, vendor, and geography. Metrics include verification hit rate, unable-to-verify share, escalation ratio, and manual override frequency. Step changes or gradual drifts in these metrics for a given source or region can flag emerging issues, whether due to registry changes, temporary outages, process modifications, or shifts in candidate profiles, even when average TAT still meets targets.
Organizations often define threshold-based alerts or tolerance bands for these measures. For example, a material increase in unable-to-verify rates for address checks in one region, or a sharp rise in escalations for a particular education board, triggers investigation into data-source health, documentation guidance, or matching rules. Where analytics maturity permits, more sophisticated anomaly detection can complement these simpler thresholds but is not a prerequisite.
To make these signals actionable, many teams embed their review into regular operational governance, such as weekly quality reviews or QBRs for key data providers. Verification Program Managers and Risk teams use the insights to adjust routing, engage vendors, or refine policies, thereby protecting headline KPIs like TAT and coverage that HR and executives monitor more closely.
If IDV failures spike due to camera or network issues, how do your reports make that clear so we don’t wrongly label candidates as fraud?
C1760 Differentiate friction from fraud — In employee IDV with liveness and face match, how does the reporting explain spikes in failures caused by device camera quality or network conditions, so Operations avoids mislabeling candidates as fraudulent?
In employee IDV with liveness and face match, reporting helps explain spikes in failures by distinguishing environmental or usability problems from fraud-related patterns. This prevents Operations from misclassifying candidates as risky when the true cause is device or network limitations.
Where client applications collect environment telemetry, failure reports can be segmented by factors such as device family, operating system, application version, and coarse network indicators like frequent timeouts. Concentrated increases in liveness or face match failures on specific device profiles or following an app release often point to technical or UX issues rather than changes in candidate behaviour. When telemetry is limited, even simple breakdowns by channel (web versus mobile), region, or time window can still reveal whether failures align with known connectivity constraints.
Reason codes produced by the verification stack, such as image quality too low, camera access denied, session timeout, or failed liveness pattern, provide additional classification. Aggregated dashboards that show the mix of these technical reasons versus more risk-oriented categories allow teams to see whether a spike is dominated by timeouts and quality issues or by signals that internal fraud teams deem suspicious.
Operations and product teams use these insights to adjust guidance, improve capture flows, or add targeted support for certain environments. At the same time, fraud-related failure categories remain visible to risk teams for investigation. Collection and use of device or network data should be aligned with consent, purpose limitation, and data minimization policies so that diagnostic reporting does not introduce unnecessary privacy exposure.
As fraud evolves, what reporting shows model drift (precision/recall) and helps us decide if thresholds need retuning?
C1771 Model drift and threshold tuning reporting — In employee BGV/IDV, when fraud patterns evolve (deepfakes, synthetic IDs), what reporting indicates whether detection models are drifting (precision/recall changes) and whether policy thresholds should be re-tuned?
When fraud patterns in employee BGV and IDV evolve toward deepfakes or synthetic identities, reporting should highlight detection model drift by tracking changes in detection quality and operational impact over time. These reports help determine whether identity proofing thresholds for selfie-ID face match, liveness, or document checks need re-tuning.
Drift reporting compares detection outcomes across periods for affected checks such as face verification, active or passive liveness, and document liveness. Programs track how often suspected frauds are correctly identified, how often legitimate users are flagged, and how many incidents are later confirmed as missed fraud. Trends that show rising false alarms or rising confirmed frauds at constant settings indicate that attack patterns or data distributions have shifted.
Policy threshold reporting logs current risk scores or rule thresholds for these checks and any changes made, along with resulting shifts in escalation ratios, manual review volumes, and TAT distributions. By reviewing these metrics together, organizations can see whether tighter thresholds meaningfully improve fraud detection or mainly increase workload and friction. This supports deliberate calibration of AI scoring engines and risk thresholds rather than ad-hoc reactions to individual fraud cases.
For board reporting, what guardrails do you provide so HR can speak credibly about impact without sounding like ‘AI magic’?
C1772 Board-safe interpretability guardrails — In employee screening analytics presented to the board, what interpretability guardrails prevent overclaiming—so a CHRO can tell a credible story about risk reduction and faster onboarding without being accused of 'AI magic'?
In employee BGV and IDV analytics presented to the board, interpretability guardrails prevent overclaiming by tying claims of risk reduction and faster onboarding to clearly defined metrics, baselines, and policy scope. CHROs should describe what changed, how it was measured, and where AI plays a supporting rather than magical role.
For risk reduction, analytics can compare discrepancy rates, adverse findings, and confirmed fraud incidents before and after structured screening, segmented by check type and role category. The narrative should state whether increased discrepancies reflect better detection rather than higher underlying misconduct. For speed, CHROs can present TAT distributions, candidate drop-off trends, and case closure rates, benchmarked against pre-implementation periods and hiring targets.
Guardrails include publishing metric definitions, clarifying which improvements come from policy expansion or additional checks, and explicitly stating where automated components like OCR, face match, or liveness checks assist human reviewers. Presentations should outline governance mechanisms such as consent management, audit trails, and model oversight to show that AI-first decisioning sits within an evidence-based trust and compliance framework. This transparency allows boards to credit measurable gains without attributing them to undefined “AI magic.”
Do you show where candidates drop off during consent and what’s confusing so we can reduce attrition without weakening consent?
C1774 Consent drop-off interpretability — In employee BGV/IDV onboarding, what interpretability is available for consent drop-offs (e.g., where candidates abandon, what language is confusing) so HR can reduce attrition without weakening lawful-consent requirements?
In employee BGV and IDV onboarding, interpretability for consent drop-offs relies on funnel reporting that shows where candidates abandon the journey, especially around consent screens, and how those patterns vary by segment. HR can then refine communication and UX while preserving the substance of lawful consent.
Journey reports track volumes from invitation through consent, data entry, and final submission. For the consent step, dashboards show the proportion of candidates who reach the consent page, the proportion who give consent, and the proportion who exit without proceeding, segmented by device type, channel, location, or role. Comparing these rates across versions of consent layouts or support features helps identify confusing wording or presentation.
To maintain compliance, any changes driven by these insights should focus on clarity, structure, and support, such as clearer headings, localized language, or contextual FAQs, rather than omitting mandatory disclosures. Reporting can then compare consent completion rates and total time-to-complete before and after UX changes, while consent ledgers ensure that captured consents are stored with scope and timestamp. This combination allows HR to reduce attrition without weakening the legal robustness of consent.
If geo checks flag legitimate travel or VPN use during remote onboarding, what reporting explains the flag and helps resolve it?
C1777 Geo-presence false positive explanations — In employee IDV during large-scale remote onboarding, what reporting and interpretability are available when geofencing or geo-presence checks conflict with legitimate travel, VPN usage, or device-sharing patterns?
In employee IDV for large-scale remote onboarding, reporting and interpretability around geofencing and geo-presence checks are needed to explain when alerts result from legitimate travel, VPN use, or shared devices. Clear logs and segment-level analytics help tune controls without undermining assurance.
Geo-presence logs record location signals and timestamps for each verification attempt, together with the rule outcome and reason, for example mismatch with expected country or access from a high-risk network. Aggregated reports then show the distribution of failed geo checks by region, role, and time window, which helps identify patterns linked to normal business travel or common remote work setups.
Interpretability for flagged events allows risk and Compliance teams to see which specific rule triggered and how it relates to the user’s expected profile or risk tier. Analysis of repeated false alarms can then support adjustments such as risk-tiered thresholds, allowlists for trusted networks, or alternative verification steps for certain cohorts. This reporting-driven tuning keeps geo-presence aligned with zero-trust onboarding principles while limiting friction and misclassification for legitimate remote employees.
For ambiguous court/police matches (aliases, fuzzy names), how do you explain the matching logic and confidence so we can defend the outcome?
C1778 Explain fuzzy matching confidence — In employee background screening, when courts/police record feeds produce ambiguous matches (aliases, fuzzy name matches), what interpretability is provided to show matching logic and confidence so Compliance can defend the decision?
In employee background screening, when court or police record feeds produce ambiguous matches from aliases or fuzzy name matching, interpretability comes from showing the attributes used for matching and the strength of each potential link. Compliance can then judge whether a record reasonably belongs to the candidate.
Match views present the candidate’s details such as name variants, date of birth, and address alongside the corresponding fields in each possible record. They highlight which attributes align, for example exact date-of-birth or district match, and which differ. Where available, a match score or qualitative band such as high, medium, or low confidence summarizes how closely the record fits the candidate profile based on the smart matching logic.
Reporting allows Compliance to filter results by case category or jurisdiction and to record a disposition such as confirmed match, false positive, or inconclusive, together with a brief rationale. Capturing both the visible matching evidence and the reviewer’s reasoning builds an audit trail that explains why an ambiguous legal record was linked or not linked to the individual. This supports defensible decisions in audits and disputes, consistent with the context’s focus on court record digitization, smart match, and explainable alerts.
Can we see exactly which rules and thresholds drove each decision, in a way an auditor can reproduce later?
C1781 Reproducible policy-engine decision logs — In employee background verification and identity verification, what interpretability is available for policy-engine decisions (rules fired, thresholds met, exceptions applied) in a way that an auditor can reproduce later?
Auditable interpretability in BGV/IDV policy engines depends on decision logs that capture which rules fired, what thresholds were evaluated, and what exceptions were applied for each verification case. Auditors can reproduce decisions more reliably when these logs are stored with clear timestamps and are tied to a specific policy version that was active at the time.
In practice, organizations benefit when the background verification platform records machine-readable rule or policy identifiers, input attributes evaluated, intermediate scores such as composite trust scores, and the final decision outcome. Interpretability improves further when the platform associates these decision entries with underlying evidence artifacts such as documents, court or criminal record responses, and address verification results that were used as inputs to the policy engine.
Governance teams typically combine decision logs with broader audit trails and chain-of-custody records for policy changes. These records explain who modified risk tiers or thresholds, when the new configuration went live, and how that effective date aligns with the case timeline. This helps during DPDP- or sectoral-audit reviews, where regulators focus on explainability, lawful and consented data use, and purpose limitation rather than only on raw accuracy metrics. A common failure mode is frequent policy tuning without explicit versioning or effective-dating, which makes historical trends difficult to interpret and individual past decisions hard to defend.
If we change risk tiers or thresholds often, how do you keep reporting comparable over time so trends don’t get misread?
C1789 Trend continuity across policy changes — In employee screening governance, how do you ensure reporting remains interpretable when policies change frequently (new risk tiers, new thresholds), so historical trends are not misread due to shifting definitions?
BGV/IDV reporting remains interpretable under frequent policy changes when metrics are explicitly linked to the policy versions, risk tiers, and check bundles that produced them. Analysts can then read historical trends in the context of the configuration that was active at the time rather than assuming a single, stable definition.
One effective pattern is to store identifiers for policy or configuration versions alongside case records and decision logs. This allows reporting to segment KPIs such as discrepancy rates, TAT, escalation ratios, and hit rates by policy version, or at least to annotate trend lines with key change events like adding new checks, tightening thresholds, or enabling continuous monitoring. When such changes occur, observed shifts in metrics can then be interpreted as a combination of policy effects and underlying risk or volume changes rather than as pure operational performance issues.
Supporting documentation, including metric definitions and change logs, further reduces misinterpretation. A data dictionary that explains how each KPI is computed, and a governance record that describes why specific policy updates were introduced, help stakeholders understand whether metric movements reflect altered risk appetite, new regulatory obligations, or process degradation. Without this linkage between reporting and policy evolution, organizations risk drawing misleading conclusions from time-series dashboards and may overreact or underreact to apparent performance swings.
How do your reports explain why escalations differ across business units without turning into political finger-pointing?
C1792 Responsible variance explanations — In employee BGV/IDV, what reporting explains variance responsibly—such as why one business unit has higher escalations—without triggering political finger-pointing or unfair performance management?
In employee BGV/IDV governance, reporting explains variance responsibly when it presents metric differences across business units with enough context to invite investigation rather than blame. The reporting should highlight potential drivers such as risk tiers, check depth, geography, and candidate mix alongside escalations, TAT, and discrepancy rates.
A practical approach is to segment key KPIs by business unit while also indicating which check bundles and policy configurations apply to each segment. For example, a unit that uses more extensive criminal and court checks or additional employment and education verification may show higher escalation ratios and longer TAT than a unit that runs lighter screening. If the report makes these policy differences visible, stakeholders are less likely to treat variance as a simple performance score.
Access and interpretation also matter. Sharing such reports in cross-functional governance settings allows HR, Compliance, and Operations to examine whether variance stems from policy choices, operational bottlenecks, data quality issues, or genuinely higher-risk hiring patterns. At the same time, limiting overly granular distribution of sensitive variance metrics can reduce the risk that they are misused in individual performance management without proper context. Without these safeguards, raw comparisons of escalation or discrepancy rates can fuel political finger-pointing and erode trust in the verification program.
Do you provide reporting documentation like a data dictionary, metric definitions, and lineage so our data team can validate the KPIs?
C1793 Reporting metric definitions and lineage — In employee BGV/IDV deployments, what technical documentation accompanies reporting—data dictionaries, metric definitions, and lineage—so Data/AI teams can validate that KPIs are computed consistently across sources?
In BGV/IDV deployments, reporting becomes reliable for Data and AI teams when it is supported by technical documentation that explains data structures, metric definitions, and lineage. This documentation enables consistent KPI calculation across sources and reduces the risk of misinterpreting background verification data in downstream analytics.
A data dictionary for reporting should describe each field, including case identifiers, check types, status codes, timestamps, and any risk or trust scores produced by the system. Metric definitions need to specify precisely how KPIs such as TAT, hit rate, false positive rate, escalation ratio, and case closure rate are computed, including which events are in scope, how time windows are measured, and how retries or partial completions are treated.
Lineage descriptions add another layer by indicating which upstream systems or data feeds populate each field and what key transformations, such as normalization, deduplication, or smart matching, occur along the way. This is particularly important when verification draws on multiple registries, court databases, HRMS/ATS sources, and risk intelligence feeds under changing policies and check bundles. In regulated and data-intensive environments, such documentation supports explainability, model risk governance, and audit readiness by showing that reported KPIs and analytical inputs are computed in a controlled and repeatable manner.
Auditability, artifacts & governance
This lens ensures regulator-ready artifacts, consent management, chain-of-custody, and artifact portability for compliance and procurement governance.
What audit evidence do you provide for consent, purpose, and chain-of-custody for each BGV/IDV step (DPDP-ready)?
C1738 DPDP-ready audit artifact set — In India-first employee background screening, what audit artifacts should a BGV/IDV vendor provide to demonstrate consent capture, purpose limitation, and chain-of-custody for each verification step under DPDP expectations?
In India-first employee background verification and digital identity verification, audit artifacts should allow organizations to show, for each case, how consent was obtained, how processing stayed within stated purposes, and how data and evidence moved through the system under controlled chain-of-custody. These artifacts support DPDP-aligned governance and external audits.
For consent capture, vendors should provide records that link each verification case to a specific consent event. These records typically include timestamps, the channel and form used, the consent text or reference to the policy shown, and the scope of checks authorized. Where consent is withdrawn, logs should show the time of revocation and any subsequent restriction or deletion actions.
For purpose limitation and data minimization, audit materials should document how check bundles and data flows are configured by role type and use case. Configuration logs can show which checks were activated for which categories of hire and which data sources were queried. Policy documents and system logs should support that only attributes relevant to the defined purposes were collected and used.
Chain-of-custody artifacts should provide a chronological trail of verification events at the case level. This includes document uploads, identity and liveness checks, registry queries, manual reviews, and final decisions, each with timestamps and identifiers for systems or users involved. Access logs should indicate who viewed or modified data and when.
In addition to per-case views, organizations benefit from aggregated reports that summarize consent SLAs, deletion SLAs, and access patterns across a period. Such reports help demonstrate that consent capture, retention, and deletion obligations are being met at scale, not only in isolated cases.
How do your reports show which thresholds and policies caused a case to be cleared or escalated?
C1739 Policy threshold decision traceability — In employee BGV/IDV decisioning, how do you link policy thresholds (e.g., match-score cutoffs, risk tiers, manual review triggers) to reporting so a Compliance Head can justify why a case was auto-cleared or escalated?
In employee BGV and IDV decisioning, linking policy thresholds to reporting means that match-score cutoffs, risk tiers, and manual review triggers are recorded and visible in metrics so that Compliance can see how these settings influence auto-clear and escalation outcomes. This turns risk policies into measurable controls rather than static documents.
Organizations should start by expressing thresholds and rules in a structured format. Examples include the minimum acceptable face or document match score for automatic clearance, criteria for assigning candidates to low-, medium-, or high-risk categories, and conditions that always require manual review, such as specific types of criminal or court hits or defined lengths of employment gaps.
Each time a case is processed, the system should log which thresholds and rules were evaluated and which ones fired. These logs should capture the rule version active at the time so that historical decisions remain interpretable after policies are updated.
Reporting can then summarize, over a period, how many cases fell into each risk tier, how many were auto-cleared versus manually reviewed, and which rules most frequently caused escalation. Simple tables or charts can highlight where cases cluster around specific score cutoffs and how often human reviewers override automated suggestions in those regions.
Compliance leaders can use these linked views to evaluate whether thresholds are calibrated appropriately. Persistent patterns of overrides or concentrations of cases just above or below a cutoff may indicate that a threshold needs adjustment or that additional guidance is required for reviewers. This linkage between configuration and outcomes strengthens audit explanations for why specific cases were auto-cleared or escalated.
How detailed is the reviewer audit trail (edits/overrides/evidence decisions), and can auditors search it easily?
C1744 Reviewer action audit trail search — In BGV/IDV case management, what audit trail granularity is expected for each reviewer action (edits, overrides, evidence acceptance/rejection), and how is that made searchable for internal audits?
In BGV and IDV case management, audit trails are expected to log reviewer actions at a granular level so that organizations can reconstruct how each case was handled. Each significant event, such as an edit, override, or evidence acceptance or rejection, should be recorded with timestamp, actor or system identity, and the relevant before-and-after values.
Commonly logged events include field edited, document uploaded, document rejected, discrepancy raised, discrepancy cleared, score or risk category changed, and case status transitioned. Many programs also log automated elements such as initial risk scores, data-source responses, and rule evaluations to support model risk governance. Where governance policies require justification, override events are configured to capture a reason code or free-text comment, though enforcement of mandatory comments varies by organization.
For internal audits, platforms usually expose search and filter capabilities over these logs. Auditors can query by case identifier to view the full chain-of-custody for a specific candidate or query by user or role to review patterns of overrides and escalations. Filters often include date ranges, event types, and outcome severity levels so investigators can quickly locate relevant actions.
When evidence is prepared for regulators or external auditors, organizations typically export a scoped subset of the audit trail that aligns with data minimization and role-based access policies. This scoped view links system-generated outputs and human decisions without exposing more personal data than necessary, helping satisfy explainability, dispute resolution, and privacy governance requirements.
Can you generate a single candidate ‘evidence pack’ with consent, doc checks, liveness, match score, and the decision reason?
C1745 Single-candidate evidence pack generation — In India-first BGV and IDV programs, how do you generate a regulator-ready evidence pack for a single candidate that includes consent artifacts, document validation results, liveness outputs, match scores, and decision rationale?
In India-first BGV and IDV programs, a regulator-ready evidence pack for a single candidate is typically a structured bundle that combines consent artifacts, identity proofing outputs, background check results, and documented decision rationale. The objective is to show lawful basis and verification steps in a way that is explainable and auditable.
The consent section usually contains time-stamped consent records, consent ledger entries, and a clear statement of purposes that match the original onboarding journey and DPDP-aligned policies. Identity verification evidence then summarises document validation results, such as checks against national identifiers or registries, and may include document metadata, data-source response references, liveness test outcomes, and associated face match scores. When programs operate under sectoral guidance like RBI KYC or Video-KYC, relevant liveness or geo-presence indicators are included as separate fields rather than exposed raw signals.
Background verification components add check-wise outputs for employment, education, address, and criminal or court records. Each check is typically documented with issuer or data-source details, attempt logs, discrepancy flags, and final status labels such as verified, discrepancy, or unable to verify. Where risk intelligence feeds such as sanctions or adverse media are used, the pack often includes the matched entity, alert reason, recency, and how the alert was adjudicated.
The decision rationale section links these inputs to the final employment or onboarding decision. It commonly records the applied policy or risk tier, aggregated risk score, any human overrides, and reviewer comments. Many platforms can be configured to assemble this data into exportable reports or data files, but achieving near-instant generation usually requires up-front design of templates, redaction rules, and field mappings so that sensitive identifiers are handled in line with purpose limitation and data minimization requirements.
How do you do role-based reporting so HR, Compliance, and IT each see what they need without exposing extra PII?
C1751 Role-based reporting and PII limits — In employee BGV/IDV programs, what role-based access controls (RBAC) are typically required for reporting so HR sees outcomes, Compliance sees evidence, and IT sees telemetry without overexposing PII?
In employee BGV and IDV programs, role-based access controls for reporting are designed so that HR, Compliance, and IT each see only the data necessary for their functions. This limits exposure of PII while still enabling effective hiring decisions, governance, and technical operations.
HR users generally need candidate-level outcomes and limited context to support adjudication and communication. Their reporting views usually include overall case status, check-level results, discrepancy flags, and risk categories. For especially sensitive roles, such as senior leadership or regulated positions, HR and Risk may agree on broader evidence access under documented policy, but this is still controlled by role definitions and approvals.
Compliance and risk teams require access to deeper evidence layers, including consent artifacts, check details, audit trails, and decision rationale. Their reporting supports audits, dispute handling, and policy enforcement, so it often exposes more granular data than HR dashboards, subject to privacy and minimization rules. IT and security teams typically access technical telemetry like API uptime, latency, error rates, and webhook performance, with identifiers masked or tokenized wherever possible.
When full identifiers are necessary for troubleshooting, organizations commonly use time-bound, audited access mechanisms rather than broad permanent rights. External auditors usually receive scoped, time-limited exports or dedicated views rather than continuous dashboard access. Documented RBAC policies and access logs form part of the verification governance framework, demonstrating alignment with need-to-know, purpose limitation, and data minimization principles.
Do you track disputes and redressal SLAs (what was challenged, what evidence was resubmitted, and resolution timelines)?
C1752 Dispute and redressal SLA reporting — In employee background verification dispute resolution, what reporting captures candidate challenges, evidence resubmissions, and redressal SLAs so HR and Compliance can prove fairness and responsiveness?
In employee background verification dispute resolution, reporting should capture the full lifecycle of candidate challenges and related redressal steps so HR and Compliance can evidence fairness, accuracy, and responsiveness. Structured tracking of disputes also supports regulatory expectations around correction and redressal.
Most programs distinguish formal disputes about the correctness of verification results from general candidate queries. For disputes, reporting typically records when the candidate raised the challenge, how it was categorized, and which checks or data elements were contested. Subsequent events, such as requests for additional documents, candidate resubmissions, reviewer reassessments, and any outcome updates, are logged with timestamps to measure redressal SLAs.
Aggregate dashboards often show dispute volumes, normalized dispute rates relative to completed checks, and resolution time distributions segmented by check type, geography, or business unit. Reporting also differentiates disputes that resulted in amended outcomes from those where the original decision was upheld. Elevated dispute rates or long resolution times in particular segments can signal issues in data sources, explanation quality, or policy application.
For regulators and auditors, organizations usually prepare scoped case-level timelines that combine original evidence references, candidate submissions, key reviewer notes, and final decisions while respecting data minimization and any internal confidentiality rules. These artifacts demonstrate that candidates have access to structured redressal channels, that correction requests are processed within defined SLAs, and that dispute handling is integrated into the broader BGV governance framework.
If we ever switch vendors, can we export audit trails, evidence packs, and decision logs in a standard format?
C1753 Portability reporting for vendor exit — In BGV/IDV procurement and governance, how can reporting be structured to support exit planning—such as standardized exports of audit trails, evidence packs, and decision logs for portability to another vendor?
In BGV and IDV procurement and governance, reporting that supports exit planning focuses on making audit trails, evidence references, and decision logs exportable in structured formats. This reduces lock-in risk and allows organizations to preserve regulatory defensibility and historical context when changing vendors or bringing operations in-house.
Exit-ready reporting usually standardizes core case data into exports that include candidate or employee identifiers, consent references, check types, outcomes, key timestamps, and decision rationale fields. Case-level audit trails, with event types, actor roles, and timestamps, are also exported so that internal teams or successor solutions can reconstruct who acted when, even if fresh verification is later performed for assurance or regulatory reasons.
Evidence-related reporting often records references to document validation results, issuer confirmations, and risk alerts rather than assuming all original artifacts will be transferred. Data protection rules, contracts, and retention policies determine which documents can be shared with a new processor, so exit planning typically emphasises metadata and linkage over indiscriminate bulk transfer of files.
To keep data estates portable, organizations can incorporate export readiness into regular governance cycles, such as QBRs and renewal planning. Reporting that highlights missing consent linkages, inconsistent identifiers, or incomplete decision fields helps remediate issues early. When an exit is triggered, Procurement, Compliance, and IT can then rely on these standardized exports and governance records as the basis for controlled data migration, regulatory continuity, and agreed deletion of residual data at the outgoing vendor.
If an audit hits unexpectedly, how fast can we generate audit packs (consent, chain-of-custody, decision reasons) for a set of candidates without manual work?
C1756 Emergency audit pack turnaround — In an employee BGV/IDV program facing a surprise regulatory audit, how quickly can a Compliance Head generate regulator-ready audit artifacts (consent ledger entries, chain-of-custody, decision rationale) for a sampled set of candidates without manual stitching?
In an employee BGV and IDV program facing a surprise regulatory audit, the Compliance Head can generate regulator-ready artifacts quickly when consent records, chain-of-custody logs, and decision rationales are captured in a structured, evidence-by-design manner. The key enabler is preconfigured reporting and export workflows rather than ad hoc data gathering.
Mature programs maintain consent ledgers that link each case to time-stamped consent artifacts and stated purposes. Case management systems log chain-of-custody as event streams, recording who accessed or modified data and when. Decision rationale is stored in structured fields, including applied policies or risk tiers, scores, overrides, and reviewer notes. Some of these elements may reside across multiple integrated systems, such as HRMS, consent managers, and verification platforms.
When an auditor samples candidates, the Compliance team can use filters to identify the relevant cases and trigger export of scoped evidence packs. These packs usually combine consent references, verification results by check type, audit events, and decision documentation in a consistent format. Configurable templates help ensure that only necessary information is included, aligning with data minimization and purpose limitation requirements.
The achievable turnaround time depends on integration maturity, sample size, and prior testing of these workflows. Organizations that periodically rehearse audit-pack generation during QBRs or internal audits, and that maintain stable identifiers across systems, are able to respond to surprise audits far faster and with fewer manual stitching errors than those relying on bespoke extraction at the time of request.
If a mishire happens, can we show what the system flagged, what humans did, and where the miss happened?
C1758 Post-incident decision accountability — In employee background screening, when a high-profile mishire occurs, what interpretability and audit trails can HR and Risk use to show whether the platform flagged the risk and whether humans overrode or missed it?
When a high-profile mishire occurs despite employee background screening, interpretability and audit trails allow HR and Risk teams to reconstruct what the platform and reviewers knew at decision time. The central questions are whether the system flagged relevant risks and how human adjudication responded to those signals.
Case-level audit logs should record the outputs of each check, including discrepancies, any adverse media or court alerts, and the risk classifications or scores produced by rules or models where such scoring is deployed. They also track subsequent reviewer actions such as status changes, discrepancy clearances, and overrides, with timestamps and user identifiers. Even if only high-level outcomes are stored, these logs reveal whether checks completed as configured or whether configuration gaps left potential issues unexamined.
Decision rationale fields, when used, add context by capturing reviewers’ stated reasons for accepting, mitigating, or overriding risks. In practice, these notes may be brief, but they still help distinguish deliberate policy-based exceptions from unintentional oversight. Where rationale is sparse, the pattern itself can point to training or governance weaknesses.
Post-incident analysis using this data should be conducted under appropriate privacy and access controls, especially if sensitive personal or legal information is involved. Findings can then inform adjustments to risk thresholds, check coverage, escalation criteria, and reviewer training. Clear documentation of the evidence and decisions at the time of hire also supports transparent engagement with regulators, auditors, and leadership.
Do you provide reporting that cleanly separates policy, vendor performance, candidate actions, and reviewer decisions so teams can fix issues without blame games?
C1762 Blame-free cross-functional governance reporting — In BGV/IDV programs, what governance reporting supports cross-functional blame-free reviews—separating policy settings, vendor performance, candidate behavior, and reviewer decisions—so HR, IT, and Compliance can resolve issues without political escalation?
Governance reporting enables blame-free reviews in BGV and IDV programs when it structures dashboards so that policy settings, vendor performance, candidate behavior, and reviewer decisions are reported in separate, time-aligned views. Each view answers a different ownership question without mixing narratives.
A policy view lists risk tiers, check bundles, and threshold settings, along with a change log that timestamps modifications. This lets teams see when a stricter criminal record check or address verification rule began and compare outcomes before and after. A vendor performance view reports SLA adherence, hit rate, TAT distributions, escalation ratios, and uptime, filtered by check type and period, without embedding candidate or policy commentary.
A candidate behavior view reports consent drop-offs, incomplete or delayed forms, and channel-wise response times, which helps HR and UX teams own communication and journey design issues. A reviewer decision view records adjudication outcomes, override rates, and stated reasons by risk tier and check category, with links to evidence artefacts. In cross-functional reviews, HR, IT, and Compliance can walk through these views in sequence. This structure clarifies whether a problem stems from a policy change, a vendor SLA miss, candidate friction, or inconsistent manual adjudication, which reduces political escalation.
When reviewers override a decision, can Compliance see the reason, evidence, and whether it matched the policy thresholds?
C1763 Manual override rationale visibility — In employee BGV adjudication, what interpretability is available for manual overrides so Compliance can see the stated reason, supporting evidence, and whether the override aligns with policy thresholds?
In employee background verification adjudication, interpretability for manual overrides depends on structured records that show the system recommendation, the final human decision, the applicable policy thresholds, and the analyst’s stated reason with referenced evidence. Compliance can then review whether each override stays within approved discretion or crosses a defined boundary.
An override record typically includes the check type and risk tier, the risk score or rule outcome produced by the scoring engine, and the configured decision threshold for that scenario. The record then stores the analyst’s final decision, a mandatory free-text explanation, and, where possible, a coded reason category such as additional evidence, data quality issue, or context-specific exception. Links or identifiers for supporting artefacts like documents, field visit reports, or court record extracts allow reviewers to inspect the underlying evidence.
Reporting that aggregates overrides by check category and risk tier, and highlights overrides that cross hard policy lines, gives Compliance a sampling frame for deeper review. Compliance can compare the override record to the written policy for that check type and determine whether thresholds remain appropriate or whether analysts are using discretion inconsistently. This interpretability reduces ambiguity in audits because it shows not just that an override occurred but why it occurred and how it related to the configured policy logic.
For field address verification, what reporting and evidence do you give (geo-tag, timestamps) to defend against fake or low-quality visits?
C1765 Defensible field verification evidence — In India-first employee background checks that use field address verification, what reporting and evidence standards (geo-tag, proof-of-presence, timestamps) are needed to defend against complaints of fabricated visits or low-quality field work?
In India-first employee background checks that use field address verification, defensible reporting depends on capturing proof-of-presence artifacts such as geo-tags, timestamps, and structured visit logs for each case. These artifacts reduce the risk of complaints about fabricated visits or low-quality field work by creating verifiable evidence for auditors and dispute resolution.
A field visit record typically stores GPS coordinates and visit timestamps associated with the case identifier, plus any photos or documents collected on-site. Geo-tagging shows that the visit occurred at the expected location, and timestamps demonstrate that it happened within agreed service windows. Structured visit forms capture the outcome of the verification attempt, for example whether the address was accessible and whether the verifier could corroborate residency, without collecting unnecessary personal data.
Operational reporting can then summarize visits by case and by field agent, including attempted versus completed visits, revisit rates, and patterns such as unusually short or clustered visits that may signal quality concerns. When these records are included in the broader audit trail and chain-of-custody for address verification, organizations can show regulators and complainants exactly when and where verification occurred, which strengthens both compliance defensibility and vendor governance.
How do you avoid a situation where exec dashboards look green but Compliance can’t reproduce evidence for sampled cases?
C1766 Prevent green-dashboard false comfort — In employee BGV/IDV reporting, how do you prevent 'dashboard theater' where executives see green SLAs while Compliance cannot reproduce the underlying evidence for sampled cases?
Employee BGV and IDV reporting avoids “dashboard theater” when executive SLA views are directly traceable to case-level records with clear metric definitions. Executives may see green indicators for TAT or hit rate, but Compliance must be able to reproduce those metrics and access underlying evidence for sampled cases.
This requires that top-level tiles and charts derive from a governed case data set where each verification carries timestamps, check outcomes, escalation flags, and decision states. For TAT reporting, definitions specify which timestamps are used, whether escalations pause timers, and how partial completions or “unable to verify” outcomes are treated. For hit rate and case closure rate, definitions clarify inclusion and exclusion rules for different check types.
Dashboards should support drill-down from SLA views to case lists and then to full audit trails containing consent artifacts, evidence documents, and decision logs. Compliance can select a sample of cases and verify that reported TAT, outcome category, and escalation handling match the stored chain-of-custody. When calculation logic and evidence access are aligned in this way, dashboards become trustworthy governance tools rather than optimistic summaries that cannot withstand audit review.
How do your reports prove data minimization—what PII we collected for what purpose, and when we deleted it?
C1767 Prove minimization and deletion actions — In employee screening governance under DPDP-like privacy expectations, what reporting proves data minimization—showing which PII fields were collected for which purpose, and when retention/deletion actions were executed?
In employee screening governance under DPDP-like privacy expectations, reporting proves data minimization when it maps collected PII fields to explicit purposes and shows when retention and deletion actions were executed for each case. These reports demonstrate that the program collects only what is needed and disposes of it according to agreed schedules.
A minimization report groups personal data into categories such as identity details, address information, employment or education records, and, where justified, criminal or court record data. For each category, the report shows the declared purpose and risk tier, for example pre-employment screening for a high-risk role, and which specific fields were actually captured. This makes it visible that lower-risk roles use leaner check bundles, while richer data sets are limited to justified scenarios.
Retention and deletion reporting lists timestamps for data creation, last access, scheduled retention end date, and actual deletion events for each verification case. Aggregated views show deletion SLA performance and highlight overdue records. When linked to a consent ledger that records consent scope and any revocation, these reports provide auditors and regulators with evidence that the organization respects purpose limitation, minimization, and deletion obligations within its BGV and IDV workflows.
Do you support parallel runs and rollback reporting so leadership feels safe switching from the current vendor?
C1768 Parallel-run and rollback reporting — In BGV/IDV vendor governance, what reporting supports a 'reversible decision' approach—such as parallel-run comparisons, rollback readiness, and clear deltas—so the executive sponsor can reduce fear of being blamed for switching vendors?
In BGV and IDV vendor governance, reporting enables a “reversible decision” when it provides side-by-side metrics for parallel runs and visibility into how easily traffic can be routed back. Executives are more willing to switch vendors when they can see quantified performance deltas and retain a clear operational exit path.
Parallel-run reporting compares incumbent and new vendor performance for the same time window and similar case mix. Dashboards show TAT distributions, hit rate, escalation ratios, and candidate drop-off rates by check type, risk tier, and business unit. Where fraud detection models are in scope, reports also track precision, recall, and false positive rates so buyers can see whether risk assurance is improving or degrading. Compliance can review whether consent artifacts, audit trails, and deletion SLAs are at least equivalent across both stacks.
Reversibility reporting describes how volume is split during transition, which integrations and workflows still depend on the incumbent, and what routing rules control case assignment. Simple indicators such as percentage of volume on each vendor and time-to-switch for routing changes give executives confidence that, if quarterly reviews or QBR packs show unexpected regressions, they can revert flows without disrupting hiring or onboarding.
Can Finance/Procurement see the real cost drivers in reporting (check mix, rework, escalations) without seeing candidate PII?
C1773 Cost-driver reporting without PII — In employee BGV/IDV reporting, how do you design dashboards so Finance and Procurement can see the cost drivers (check mix, rework, escalations) without exposing sensitive candidate PII?
In employee BGV and IDV reporting, dashboards can show Finance and Procurement the cost drivers of verification programs by aggregating data at check and segment level, while omitting direct candidate identifiers. This design explains unit economics and cost creep without exposing unnecessary PII.
Cost-focused views break down spend by check type, risk tier, business unit, and outcome category such as completed, escalated, re-verified, or “unable to verify.” They display metrics like cost per verification, proportion of spend on rework, and volume of exception-driven cases. Correlating these with operational KPIs such as TAT, escalation ratio, and hit rate helps commercial stakeholders see which checks or segments are structurally more expensive.
To align with DPDP-style purpose limitation, Finance and Procurement access only aggregated or segment-level data. Dashboards group volumes by role bands, locations, or business units rather than showing names or contact details. Where case-level analysis is needed for dispute handling, anonymized case IDs can be used, with personal details restricted to HR and Compliance. This separation allows commercial teams to manage budgets and contracts while keeping candidate-specific PII exposure to the minimum necessary.
For leadership approval, what’s the minimum reporting pack that makes this feel like a safe, proven choice?
C1775 Minimum safe-standard reporting pack — In employee BGV/IDV reporting for executive sign-off, what is the minimum set of metrics and artifacts that makes the decision feel like the 'safe standard' rather than an experiment?
For executive sign-off on employee BGV and IDV, a minimal reporting set should combine a few core metrics with representative evidence artefacts so the program looks like an established standard, not an experiment. The pack must show performance, governance, and audit readiness.
The core metrics typically include TAT distributions for major check bundles, discrepancy or hit rates by check type, escalation ratios, and candidate drop-off rates. These are segmented by key role categories or risk tiers and compared to pre-implementation baselines to show directional improvement in speed and risk detection. Stability indicators such as uptime and case closure rate demonstrate that operations can meet SLAs consistently.
The artefact set includes samples of full case audit trails, descriptions of consent capture and ledger design, and summaries of retention and deletion policies. If AI scoring engines or complex rules are used, a short note on how thresholds are governed and reviewed is also included. Together, these metrics and artefacts give executives comfort that the BGV and IDV program is measurable, auditable, and aligned with privacy and compliance expectations, rather than a loosely controlled pilot.
Do you have a simple checklist of minimum audit artifacts per check type so analysts build consistent, defensible case files?
C1780 Minimum artifacts checklist per check — In employee BGV/IDV, what operator-level checklist defines the minimum audit artifacts per check type (EV/EMV/CRC/AV/IDV) so verification analysts consistently produce regulator-defensible case files?
In employee BGV and IDV operations, an operator-level checklist that defines minimum audit artifacts for each check type helps analysts assemble regulator-defensible case files consistently. The checklist aligns with common workstreams such as employment verification, education verification, criminal record check, address verification, and identity verification.
For employment and education verification, the checklist typically requires evidence of issuer confirmation or documented attempts, timestamps of outreach, and copies or references of supporting documents used to corroborate tenure, designation, or qualifications. For criminal record checks, it specifies court or police search outputs, key matched attributes such as name and date of birth, and a disposition note stating whether any records are linked to the candidate.
For address verification, required artifacts include digital or field visit evidence such as geo-tagged images where used, visit logs with timestamps, and a clear outcome summary. For identity verification, the checklist covers captured identity documents, recorded verification steps such as face match or liveness where applicable, and the final decision outcome. Across all check types, the checklist also points to required consent records and case-level audit trails, and references applicable retention or deletion rules. Embedding this structure into daily operations and quality reviews promotes consistent chain-of-custody and simplifies audit and regulator engagement.
How do you set up reporting views so HR sees clear outcomes and next steps without seeing sensitive risk signals that should stay with Risk/Compliance?
C1782 Reporting views to reduce mistrust — In employee BGV/IDV with multiple internal stakeholders, what reporting permissions and views reduce inter-department mistrust—for example, ensuring HR cannot see sensitive risk signals while still seeing clear outcomes and next steps?
Reporting permissions in BGV/IDV reduce inter-department mistrust when they clearly separate access to sensitive risk signals from access to operational outcomes and next steps. HR can then manage hiring decisions based on verification status and recommended actions, while Compliance and Risk teams work with more detailed risk intelligence where needed.
A practical pattern is to configure role-based views so that HR sees case status, turnaround-time indicators, escalation flags, and standardized decision outcomes for each candidate. Compliance and Risk teams can be given additional views that expose granular check-level outputs across employment, education, address, criminal or court records, and sanctions or adverse media screening. This aligns with privacy-first and data-minimization expectations by restricting exposure of detailed records to functions that need them for regulatory defensibility.
Organizations can also use shared, aggregate dashboards for metrics such as overall discrepancy rates by check type, TAT distributions, escalation ratios, and case closure rates. These aggregate reports help HR, Compliance, and Operations align on performance and SLA adherence without exposing raw PII or sensitive legal findings to every stakeholder. A common governance risk occurs when HR is granted unrestricted access to raw investigation data for convenience, which can undermine privacy controls and weaken the clear separation of duties that regulators expect in verification and compliance workflows.
How do your reports show consent revocation—when it happened, what processing stopped, and what data was deleted or retained?
C1787 Consent revocation and deletion proof — In India-first employee screening under DPDP expectations, what reporting proves consent revocation handling—showing when consent was withdrawn, what processing stopped, and what data was deleted or retained under lawful exceptions?
In India-first employee screening under DPDP expectations, reporting for consent revocation should clearly show when consent was withdrawn, what verification processing was stopped, and what data was deleted, anonymized, or retained under defined policies. This gives Compliance and auditors evidence that background verification and identity verification activities respect data principal rights.
A privacy-aware design uses structured consent records that log capture, use, and revocation events with timestamps and references to specific BGV/IDV cases. Reporting based on these records can outline a timeline for each individual, including initial consent, any change in purpose or scope, and subsequent revocation. For each revocation, the report should indicate which checks, such as identity proofing, employment or education verification, address checks, or criminal and court record screening, were halted and when that stoppage occurred.
Organizations can also align consent revocation reporting with documented retention and deletion schedules, making it explicit which categories of data were removed or transformed and which were retained due to stated legal or contractual obligations. A frequent governance gap appears when consent capture is logged but revocation events and downstream actions are not tracked in a consistent way, which makes it hard to demonstrate DPDP-aligned behavior during audits. Treating consent ledgers, deletion SLAs, and revocation reports as core compliance artefacts helps increase trust in India-first BGV/IDV programs.
Incident management, outages & post-mortems
This lens highlights incident timelines, outage impact, remediation actions, and post-mortem timelines to improve resilience and accountability.
Beyond price, what reporting do you provide so Procurement can compare SLA adherence, disputes, escalations, and evidence quality across vendors?
C1748 Vendor comparison reporting for Procurement — In employee background screening, what reporting helps Procurement compare vendors beyond unit price—such as SLA adherence, dispute rate, escalation ratio, and evidence-pack completeness?
In employee background screening, Procurement benefits from reporting that compares vendors on operational performance and compliance quality in addition to unit price. Key comparative metrics include SLA adherence, dispute and escalation behaviour, and the consistency of evidence delivered for audits.
SLA adherence is commonly reported as the percentage of checks or cases closed within agreed TAT thresholds, segmented by check type and region. Persistent shortfalls in these percentages can signal hidden costs such as extended onboarding cycles or extra follow-up work that are not visible in per-check pricing. Escalation ratio, defined as the share of checks requiring manual escalation or rework, highlights where data quality or matching issues are driving higher operational effort.
Dispute-related reporting counts candidate or client challenges and ties them to check volumes. For this to be comparable across vendors, organizations usually standardize what qualifies as a dispute versus a simple query. High normalized dispute rates may indicate unclear outputs, higher error rates, or weak issuer relationships, all of which increase support load and reputational risk.
Evidence-pack reporting focuses on whether each closed case contains the consent artifacts, data-source references, and audit trail entries required by internal policy. Rather than a single scalar score, many teams track specific required elements and measure the frequency with which each is present. Procurement and Risk can then jointly assess vendors on combined views of price, SLA adherence, escalation patterns, standardized dispute rates, and evidence-element coverage to estimate the true cost and risk of using each provider.
During peak hiring, if verifications stall, what reporting helps IT separate vendor latency from our HRMS/ATS integration problems?
C1757 Outage and backlog root-cause reporting — In employee identity verification during a hiring surge, what failure-mode reporting is available when an API outage or webhook backlog causes incomplete verifications, and how does IT distinguish vendor-side latency from HRMS/ATS integration issues?
In employee identity verification during a hiring surge, failure-mode reporting is most useful when it makes API outages, latency spikes, and webhook backlogs visible and separates vendor-side degradation from HRMS or ATS integration issues. Observing patterns across both external and internal telemetry helps IT understand why verifications remain incomplete.
Common reporting elements include time-stamped error logs, counts of failed and pending verification calls, and, where available, endpoint or service-level latency indicators. Spikes in server-side error codes, sudden increases in high-percentile latency, or growing queues of undelivered callbacks on the verification platform usually point to vendor or data-source pressure. When vendors expose only high-level status, local gateway or API management logs can still reveal rising timeouts or retries against otherwise stable internal systems.
To distinguish external from internal causes, organizations compare these signals with HRMS or middleware telemetry. If vendor-facing calls appear healthy while failures accumulate downstream, the issue may lie in local transformation logic, database contention, or message processing backlogs. If both external call metrics and internal logs show coincident latency spikes and failures, a vendor or network problem is more likely.
During surges, such reporting informs contingency decisions. In some contexts, organizations design risk-tiered flows and graceful degradation so that lower-risk checks can be queued or retried without blocking all onboarding, while high-risk or regulated roles remain subject to strict zero-trust rules that withhold access until verification completes. Clear visibility into failure modes supports transparent communication with HR about delays and prioritization without diluting required assurance levels.
Do you provide a QBR reporting pack tailored for Compliance, IT, HR, and Procurement with the right metrics for each?
C1779 Role-tailored QBR reporting pack — In employee BGV/IDV programs, what cross-functional reporting pack supports QBRs by separating Compliance topics (consent/deletion proofs), IT topics (uptime/latency), HR topics (drop-offs/time-to-hire), and Procurement topics (SLA credits/penalties)?
In employee BGV and IDV programs, a cross-functional QBR reporting pack supports HR, IT, Compliance, and Procurement when it presents separate sections for each function, all aligned to the same period, definitions, and segment structure. This format surfaces trade-offs without blurring accountability.
The Compliance section reports consent capture and revocation patterns, retention and deletion SLA performance, and summaries of sampled case audit trails. The IT section covers uptime, latency, error and timeout rates, and notable incidents affecting APIs, webhooks, or portals, with resolution summaries. The HR section presents TAT distributions, candidate drop-off rates, and discrepancy or hit-rate trends by check type and role category, connecting these to time-to-hire goals.
The Procurement section focuses on cost-per-verification, volume by check type and risk tier, spend attributed to rework or escalations, and a clear statement of SLA credits or penalties applied during the period. All sections use consistent segmentations and metric definitions so that, for example, “completed within SLA” means the same thing across operational and commercial views. This QBR pack structure supports ongoing governance and renewal decisions by showing each stakeholder how the BGV and IDV program is performing against its part of the trust, speed, and cost equation.
What reporting and export guarantees should we demand in the contract so we can exit cleanly if the relationship goes south?
C1783 Contractual reporting and export guarantees — In employee BGV/IDV procurement negotiations, what reporting and data export guarantees should be required to support the exit plan (portable audit trails, evidence packs, decision logs) if the vendor relationship deteriorates?
In BGV/IDV procurement, exit-ready reporting and data export guarantees should focus on preserving portable audit trails, evidence artifacts, and decision logs in formats that remain interpretable after the vendor relationship ends. This supports regulatory audits, dispute resolution, and continuity of hiring risk governance when platforms change.
Organizations can require that the background verification vendor support exports of case-level histories that include consent records, verification inputs, decision outcomes, and associated timestamps. These exports should cover major workstreams such as identity proofing, employment and education verification, address checks, criminal and court records, and sanctions or adverse media screening, while respecting data minimization and retention policies defined under regimes like India’s DPDP.
It is advisable to define, at contracting time, which decision and SLA metrics must be exportable, such as TAT distributions, hit rates, escalation ratios, and case closure rates, along with clear metric definitions. Buyers also benefit from documentation that explains how risk tiers and policy configurations were applied so historical reports can be interpreted correctly after migration. A frequent pain point arises when exit planning is ignored in the initial contract, leaving Procurement, HR, and Compliance without guaranteed access to machine-readable decision logs or consent ledgers when they most need to demonstrate how past onboarding decisions were made.
After an incident, can your reporting show a clear timeline—system health, reviewer actions, and policy changes—so IT and Compliance can align on root cause?
C1785 Post-mortem timeline reporting — In employee BGV/IDV, what scenario-driven reporting supports incident post-mortems—showing timeline of events, system health, reviewer actions, and policy changes—so IT and Compliance can agree on the root cause?
Scenario-driven reporting for BGV/IDV incident post-mortems should reconstruct a clear timeline of events that covers system behavior, reviewer actions, and policy-engine decisions. This helps IT and Compliance converge on a common view of root cause rather than debating partial or conflicting evidence.
Useful post-incident reports aggregate data from case management, technical monitoring, and governance logs. Case-level information can show when a candidate’s verification was initiated, which checks were invoked, how long each check took, and when escalations or manual reviews occurred. Technical observability data such as API latency, error rates, or third-party source downtime can indicate whether system performance or integration failures contributed to delays or decision anomalies.
Policy and governance records add another dimension by indicating which version of the policy engine was active, which rules were evaluated, and whether any manual overrides were applied during the incident window. They can also document consent capture, purpose limitation notes, and retention actions that relate to the affected cases. When these elements are pulled into a structured timeline, IT and Compliance can more easily distinguish between failures due to infrastructure, process design, or configuration, aligning with broader expectations for explainability and audit-ready operations in verification programs.